Website Usability Testing Before a Redesign: Find What to Keep, Fix, or Rebuild


Summarize with Ai





Key Takeaways
Most redesigns fail for a simple reason. The team changes how the site looks. The problems stay.
The new homepage is clean. The new fonts are sharp. But visitors still can't find pricing. The form still loses people at step three. Nothing improved, and the budget is gone.
This guide fixes that. You will learn how to test your current website before you redesign it. You will also learn how to turn the results into a simple Keep / Fix / Rebuild list.
What is website usability testing?
Website usability testing is a research method where real users try to complete real tasks on your site while you watch. You note where they succeed, hesitate, or fail. The result is a ranked list of problems backed by behavior, not opinion.
It answers one question: can your users do what they came to do?
Before a redesign, it also answers a second one: what on this site is worth saving?
Why redesigns fail without usability evidence
Teams often start with taste. Someone says the site looks old. Someone else likes a competitor's layout. The loudest opinion wins.
This is the HiPPO problem. HiPPO stands for the Highest Paid Person's Opinion. It feels fast. It is expensive.
Here is what changes when you test first.
Fixing a navigation issue on a wireframe costs a design decision. Fixing it on a live site costs development time, retesting, and sometimes lost revenue.
Usability testing vs. analytics vs. UX audit vs. A/B testing
These methods are not rivals. Each answers a different question.
The short version: analytics finds the problem page. Usability testing explains it. A UX audit is an expert review. Usability testing is real people.
A UX audit is faster and cheaper. Usability testing is more trustworthy. Many teams do both.
Step 1: Build your pre-redesign baseline
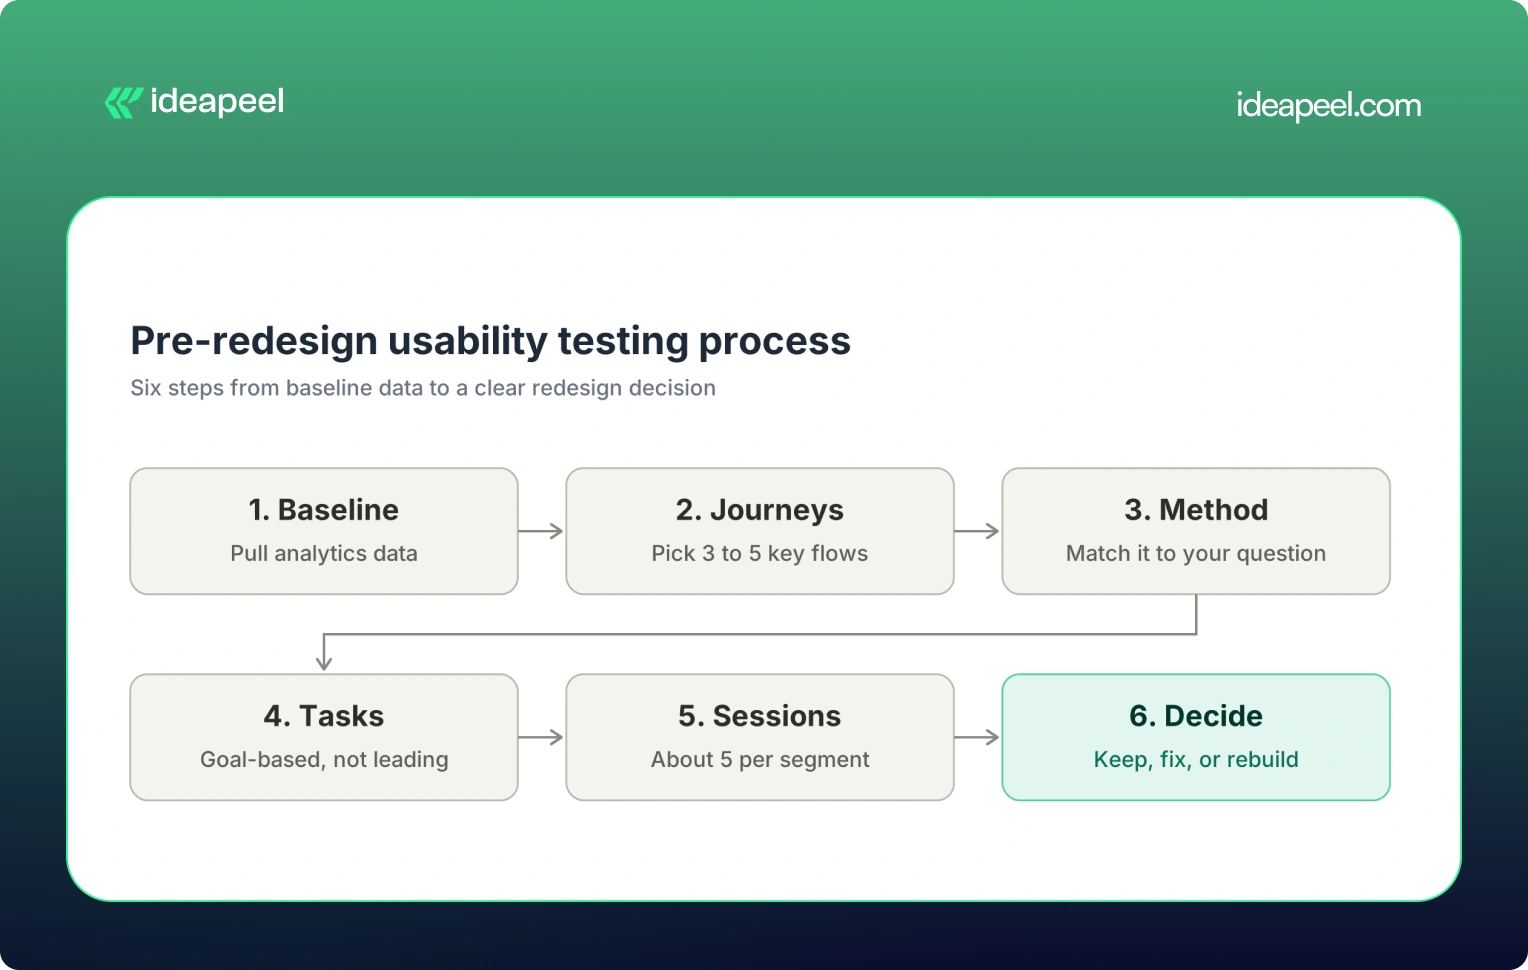
You can't prove a redesign worked if you never measured the old site. So start with numbers.
Pull data from these sources:
- Google Analytics 4: exit rates, user paths, conversion events.
- Google Search Console: which pages get impressions and clicks.
- Microsoft Clarity or similar tools: heatmaps and session recordings.
- Support tickets and sales calls: the questions customers keep asking.
Then look for warning signs:
- Many visitors leave a key page within seconds.
- Forms start but rarely finish.
- Users click things that are not links. These are often called rage clicks.
- Internal search is used for basic topics like pricing.
- Support gets the same "where do I find..." question again and again.
Write down your starting numbers. This is your baseline scorecard.
Keep this table. You will use it again in Step 8.
Step 2: Choose the journeys worth testing
Don't test 30 pages. Test 3 to 5 journeys that affect revenue.
For a SaaS or tech website, good candidates are:
- Homepage to pricing to demo booking.
- Free trial signup.
- Onboarding after signup.
- Searching the docs or help center.
- Upgrading a plan.
Score each journey on three things. Rate each from 1 to 3.
Test the highest scores first.
Also check your device mix. If most visitors use mobile, most of your sessions should use mobile. Testing on desktop alone will mislead you.
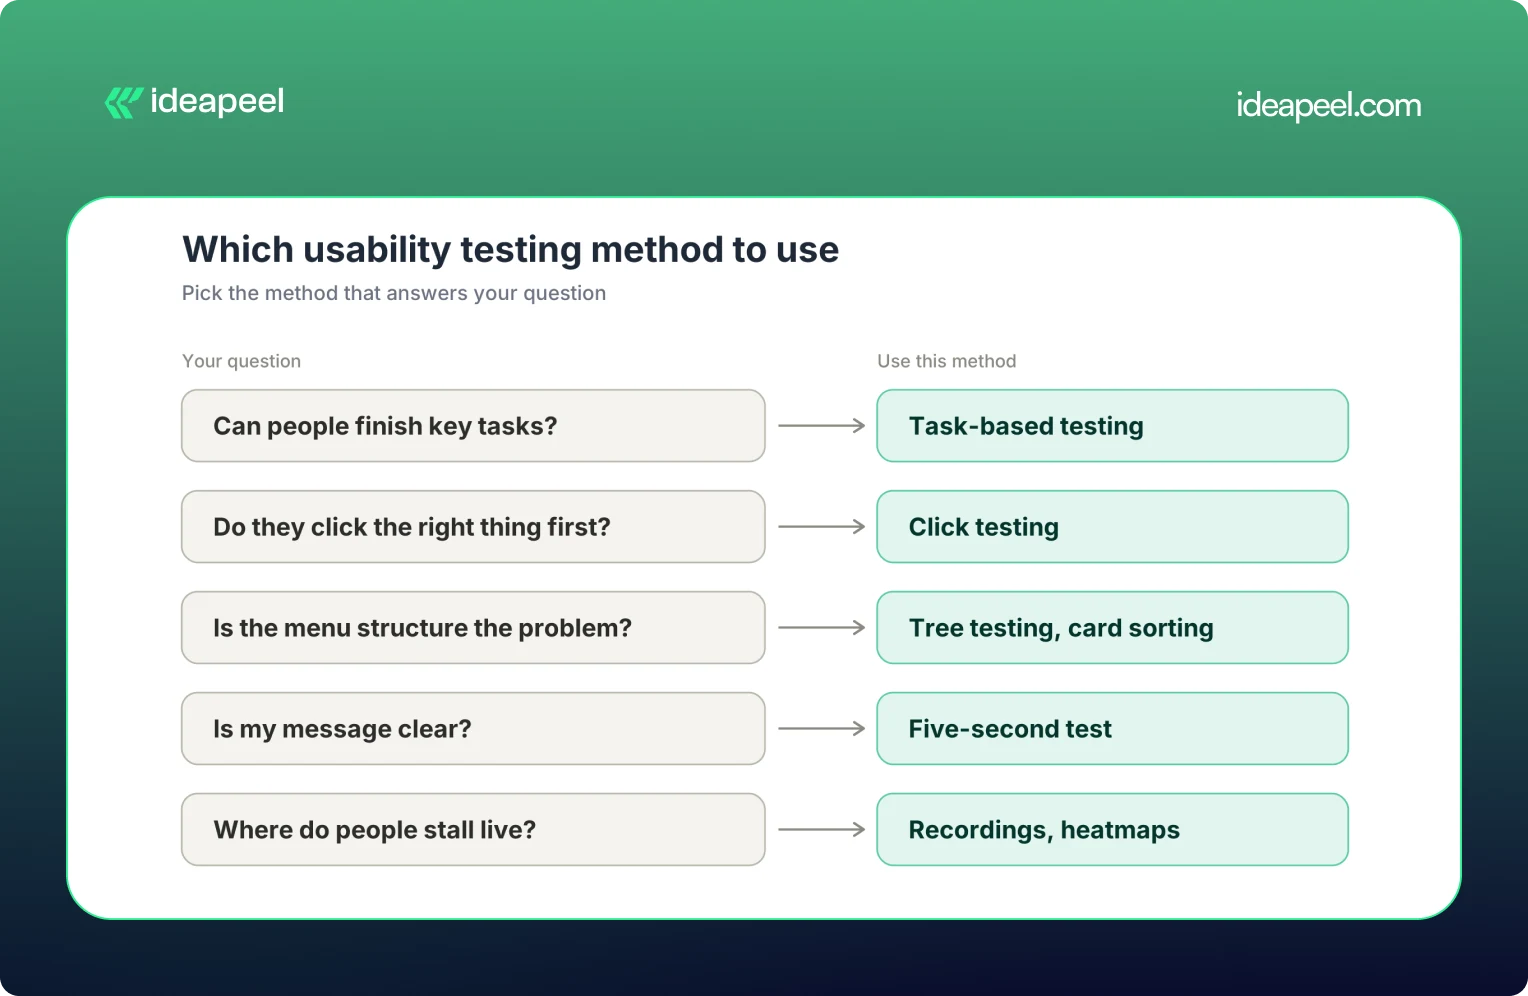
Step 3: Pick the right method for your question
Don't pick a method because it is popular. Pick it because it answers your question.
Task-based testing
A participant tries a realistic task. You watch. You ask them to think aloud.
Moderated sessions are live. You can ask why they paused. These are best for deep insight.
Unmoderated sessions run on their own. You get more participants, faster. These are best for scale.
A simple rule: use moderated when you need to know why. Use unmoderated when you need to know how many.
Tree testing
Tree testing strips away the design. Users see only your menu structure as text. They are asked where they would find something.
If they fail here, the problem is your information architecture. A new color palette won't fix it.
Click testing
Click testing shows a page and asks where the user would click first. It is quick. It works well on landing pages and navigation.
A user who makes the right first click is far more likely to finish the task. A wrong first click often predicts failure.
Tip: combine methods. Analytics finds the weak page. A usability test explains it. A short survey shows how common the issue is.
[[inner-cta]]
Step 4: Write tasks that don't lead the user
Bad tasks give away the answer. Good tasks give a goal.
You were charged twice. How would you get help?
Here are five ready-to-use scripts for a SaaS site:
- "You want to try this product for free. Get started."
- "Find out how this tool compares to the cheaper plan."
- "You need to add a teammate to your account. How would you do it?"
- "Find a guide that explains how to connect your calendar."
- "You decide to cancel. What would you do?"
Set success rules before the first session. Decide what counts as a pass, a partial pass, and a fail. If you decide afterward, you will go easy on results you like.
Step 5: Recruit and run the sessions
Who to recruit
Recruit people who match your real visitors. Don't use your own team. They already know where everything is.
Also skip close friends and power users. Their knowledge hides the problems you need to find.
If your site serves different audiences, recruit for each one. A buyer and an admin behave differently.
How many participants
A common rule says 5 users find most major problems. This comes from Nielsen Norman Group research. It works best for one audience group and a focused set of tasks.
It is not a universal rule. Use this as a guide:
- About 5 per audience segment to find problems.
- 20 or more if you need stable numbers to benchmark.
During the session
- Ask users to think aloud.
- Stay quiet. Don't rescue them.
- Watch what they do, not just what they say. A pause often shows friction better than a comment.
- Record screen and audio.
- Log each task result as it happens.
Step 6: Measure what matters (and what not to trust)
Four metrics cover most tests.
With small samples, report counts. Say "4 of 6 users failed." Don't say "67% failed." A percentage makes a small sample look more certain than it is.
Metrics that mislead
- Time without context. Fast can mean efficient. It can also mean guessing.
- Generous partial credit. It inflates your success rate.
- Praise for looks. A user can say a page "looks great" and still fail to find the buy button.
Behavior beats opinion. Always.
Common usability problems you will likely find
Tests on most sites reveal the same patterns.
- Navigation and labels. Users look in the wrong place because your labels match your org chart, not their thinking. Fix: use customer language. Retest with a tree test.
- Unclear value proposition or CTA. Visitors can't tell what you do or what to click next. Fix: lead with the outcome. Use one clear primary action.
- Pricing page confusion. Plans look alike. Limits are hidden. Fix: compare plans side by side. State who each plan is for.
- Long or confusing forms. Extra fields and vague errors cause drop-off. Fix: cut fields. Write errors in plain words.
- Mobile friction. Tap targets are too close. Tables scroll sideways. Sticky bars eat the screen. Fix: test on real phones.
- Accessibility gaps. Low contrast, weak keyboard support, and unlabeled links block some users. Fix: check against WCAG and test with assistive technology users.
- Trust gaps. Users aren't sure an order went through or what happens next. Fix: add clear confirmations and next steps.
Turn findings into a redesign decision
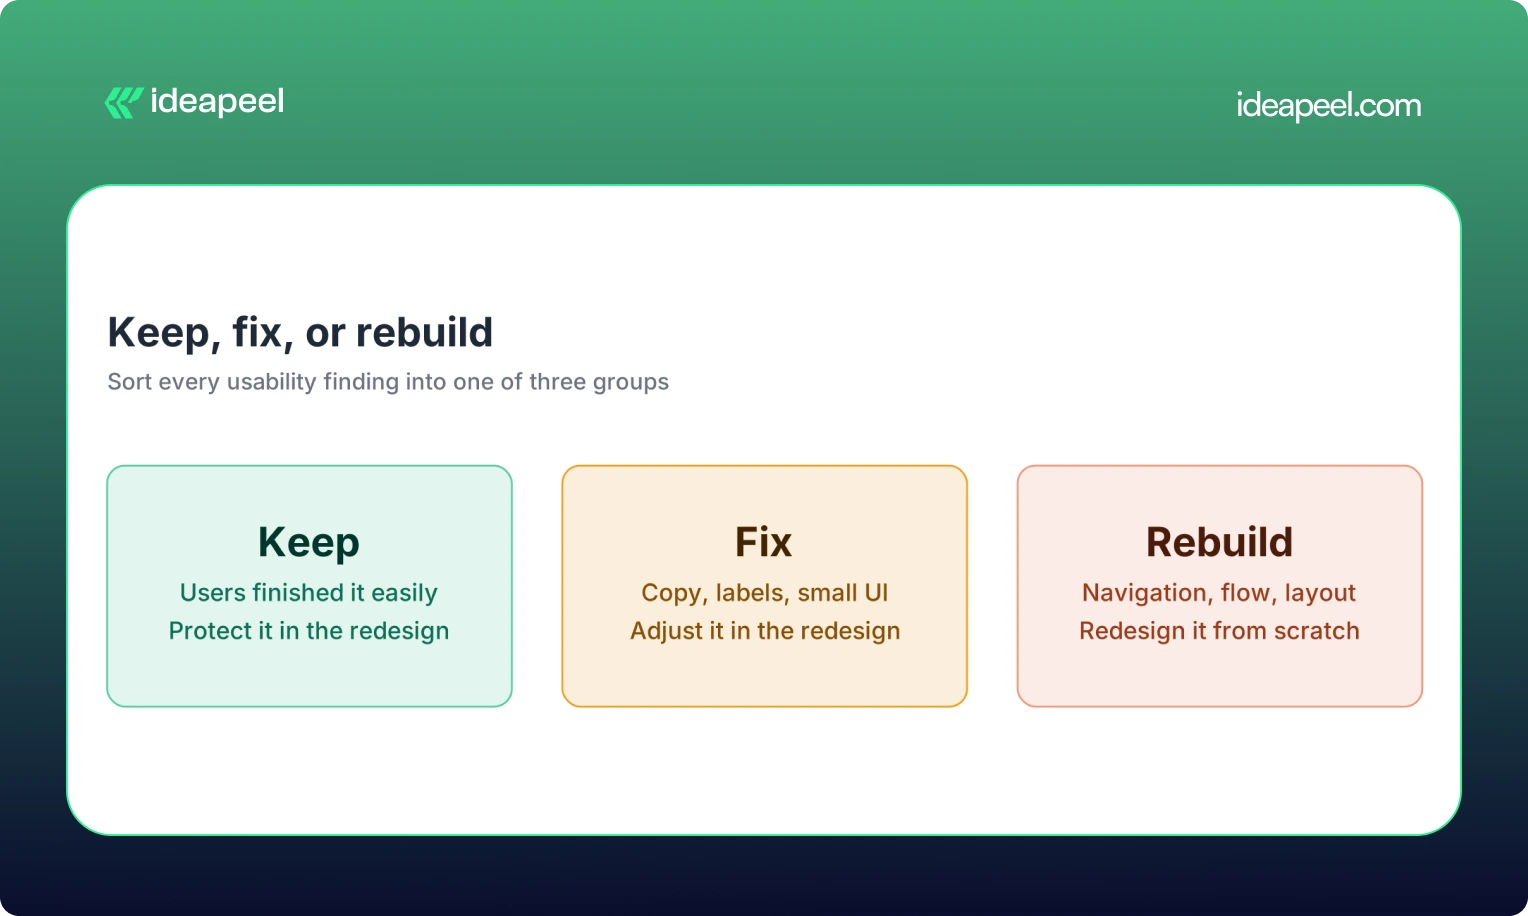
This is the step most teams skip. It is also the most valuable.
Sort every finding into one of three groups.
The Keep column matters. Many redesigns throw away things that worked.
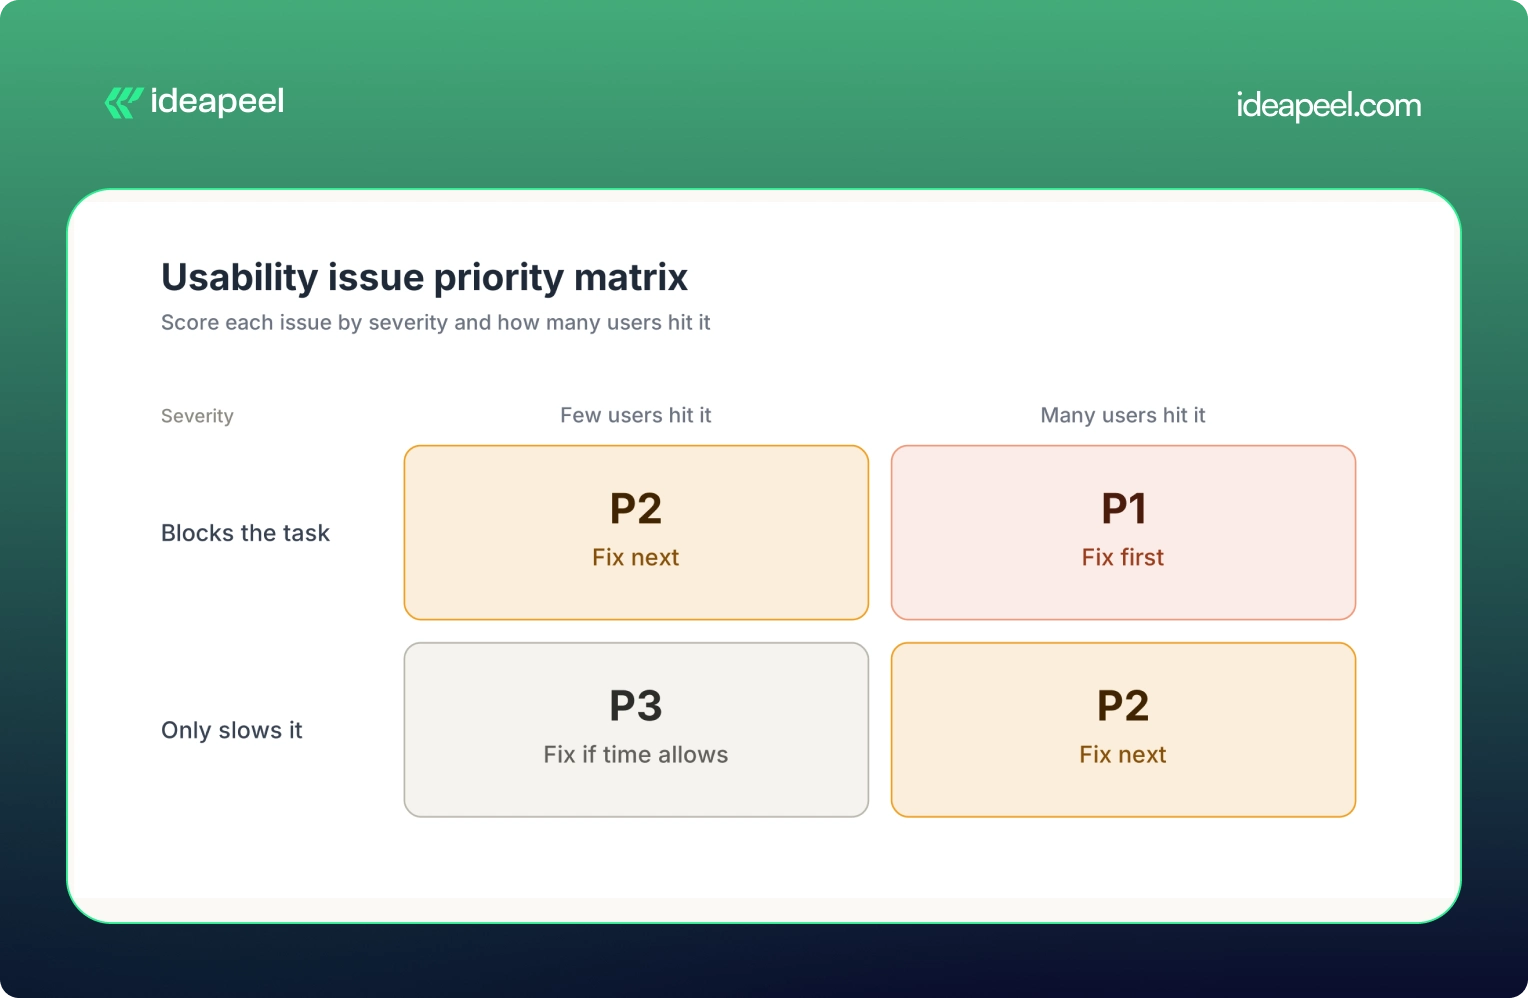
Score each issue
Rate every issue on three factors:
- Severity: does it block the task or only slow it?
- Frequency: how many users hit it?
- Business impact: does it touch revenue or leads?
Then assign a priority.
- P1: blocks a key task. Fix first.
- P2: causes real friction. Fix next.
- P3: minor polish. Fix if time allows.
Sample findings table
Each row connects a problem to proof, a fix, and a number you can track.
From findings to a redesign brief
A good brief turns research into direction. Include:
- Goals: what the redesign must achieve, such as more demo bookings.
- Priority issues: your P1 and P2 list.
- Keep list: what must not change.
- IA changes: menu and page structure updates.
- Content changes: labels, headlines, and copy fixes.
- UI requirements: components that solve each issue.
- Success metrics: the numbers from your baseline scorecard.
Then translate findings into build-ready components. A mobile filter issue becomes a sticky filter bar. A confusing menu becomes a simplified navigation. A weak pricing page becomes a clear comparison table.
If you want help doing this, our team offers UI/UX design services and website redesign services built around this exact research-first process.
Measure the website redesign against your baseline
Testing doesn't end at launch.
Retest the same tasks. Use new participants who haven't seen the old site. Then compare results against your baseline scorecard.
- Did task success go up?
- Did errors drop?
- Did form completion improve?
If a metric didn't move, don't assume it will later. Find out why. Fix it. Test again.
A fix is only a guess until a second round shows it worked.
Common mistakes to avoid
- Testing only after the build. Late fixes delay launches and inflate budgets.
- Writing leading tasks. They hide the very problems you are looking for.
- Testing only on desktop. Your mobile users will have a different experience.
- Treating opinions as behavior. What users say and what users do often differ.
- Testing without a decision in mind. If no choice depends on the result, the study won't change anything.
[[question-block]]
Pre-redesign usability testing checklist
Use this before you start.
☐ Define the business goal of the redesign.
☐ Collect baseline metrics from analytics.
☐ Review heatmaps and session recordings.
☐ List the top 3 to 5 journeys to test.
☐ Check your device split.
☐ Choose a method for each question.
☐ Write goal-based tasks.
☐ Set success criteria in advance.
☐ Recruit users outside your team.
☐ Run sessions and log results.
☐ Group issues into Keep, Fix, and Rebuild.
☐ Score issues by severity, frequency, and impact.
☐ Write the redesign brief.
☐ Plan the retest.
Not sure what to keep and what to rebuild accessibility
That is the hardest call in any redesign. ideapeel runs UX research and redesign audits for SaaS and tech websites. We find what is broken, protect what works, and design from evidence.
Talk to our team about your website.
[[last-cta]]
Frequently asked questions on Website Usabilty Test
Enter your website URL to receive a detailed website analysis report in just 5 minutes!

What is the difference between usability testing and a UX audit?
A UX audit is an expert review against known design principles. Usability testing watches real users complete real tasks. The audit is faster. The test is stronger evidence.